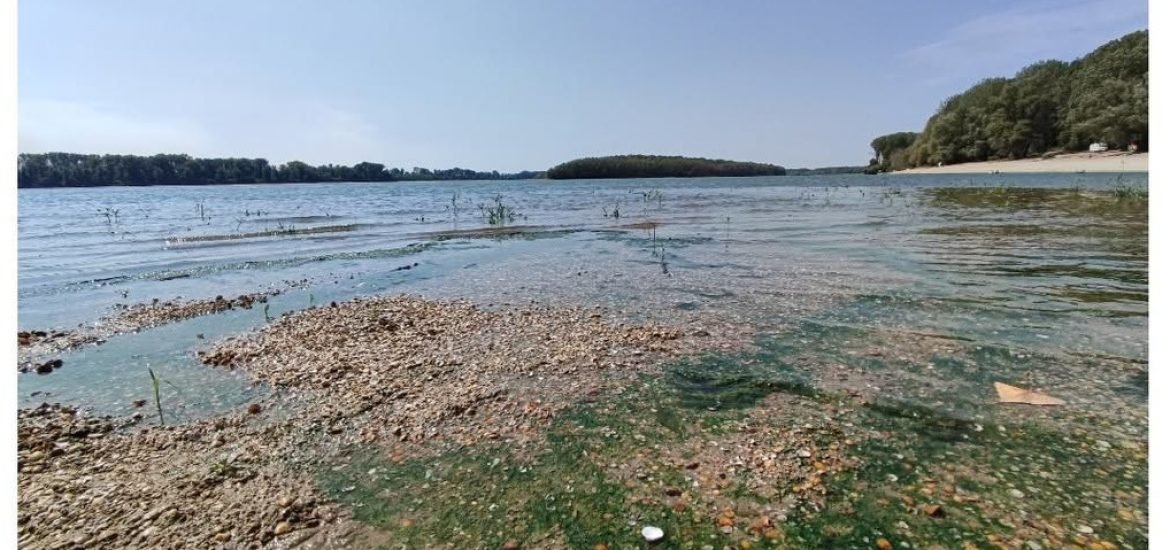
During the summer of 2026, critically low water levels of the Danube River drew attention across Europe. Numerous sandbanks emerged, navigation was disrupted [1], and World War II shipwrecks [2] and other historical relics [3] reappeared in several sections of the Lower Danube. These striking images represent, in fact, the most visible manifestation of a large-scale hydrological phenomenon unfolding within one of Europe’s major river basins.
Low seasonal water levels are not unusual for a watercourse, including the Danube River. Every summer, the flow and the water level naturally decrease as a result of reduced precipitation, high temperatures and increased evapotranspiration. The intensity of phenomenon, however, can vary from one year to another. In years with severe hydrological drought, such as 2022, low water levels have generated equally spectacular landscapes, with numerous sandbanks emerging and wrecks normally hidden under water reappearing. But, to understand the considerable decrease of the Danube’s water level, particularly, along its Lower course in 2026, we must look far beyond the river itself, specifically, far upstream.
The Danube River in Numbers
The Danube is Europe’s second-longest river, flowing 2 870 km from the Black Forest in Germany to the Black Sea through 10 countries [4]. Its basin covers more than 800 000 km², collecting waters from 19 countries. The river is divided into three main sectors: i) Upper – from its headwaters to Bratislava, ii) Middle – from Bratislava to Baziaș and iii) Lower – from Baziaș to the Black Sea. Although each sector presents distinct geographical characteristics, they all function as an integrated river system, in which upstream processes influence the evolution of the river downstream. Added to this natural dynamic are the effects of human interventions in recent decades [4], such as the construction of hydrotechnical facilities, damming works, dredging, irrigation and the extraction of sand from the riverbed or floodplain vegetation clearing. All of this has changed, over time, the hydrological regime, sediment transport, the functioning of the meadow ecosystems and implicitly the way in which the river responds today, both to floods and to periods of drought. So, the sandbanks, wrecks or fossils that have appeared in the Danube riverbed are just some of the visible signs of this complex fluvial process, which takes place on the scale of the entire Danube basin.
Reflection of Europe’s climate in the behavior of a river.
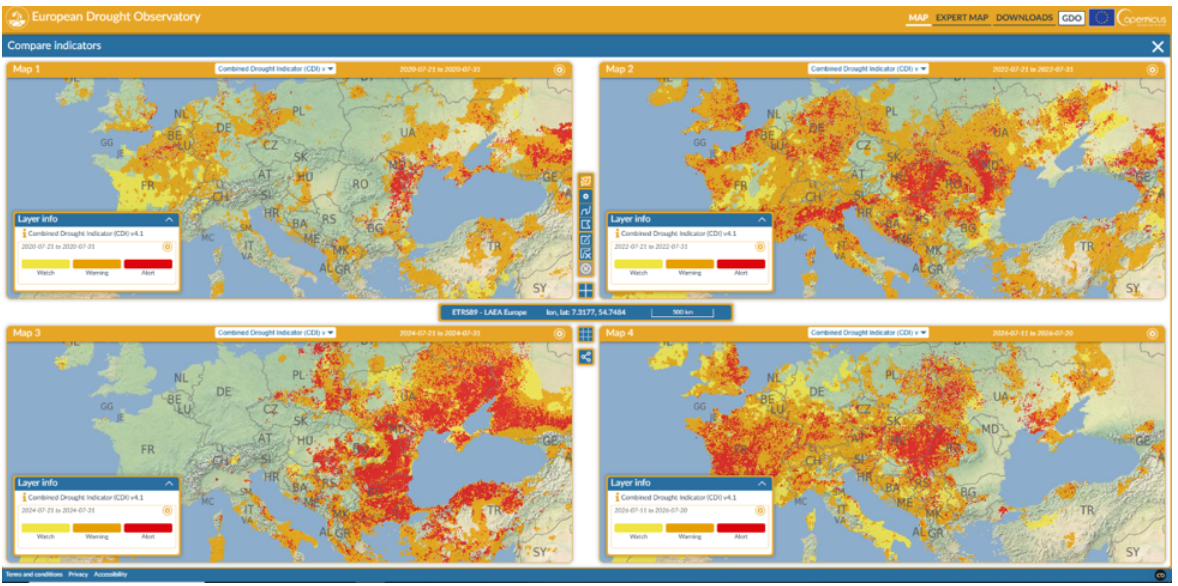
The summer of 2026 is one of the series of hydrological droughts that have affected the Danube in recent decades, but its magnitude and spatial distribution are remarkable. Maps from the European Drought Observatory (EDO) platform [5] provide a clear picture of this difference. Usually, in past years, the south-eastern area of Europe and in some places the central area have been affected by more severe drought conditions, while in 2026 the situation is different. Extensive areas of Central and Western Europe are affected by drought, including Germany, Austria, Slovakia and Hungary. These are areas from which Danube and its main tributaries collect their waters. When precipitation is deficient upstream, and high temperatures increase evaporation and reduce soil moisture, the river’s tributaries carry less water downstream. And so, the effects propagate like dominoes, even some parts of Romania experience periods of relatively higher precipitation.
What do satellite images show us?
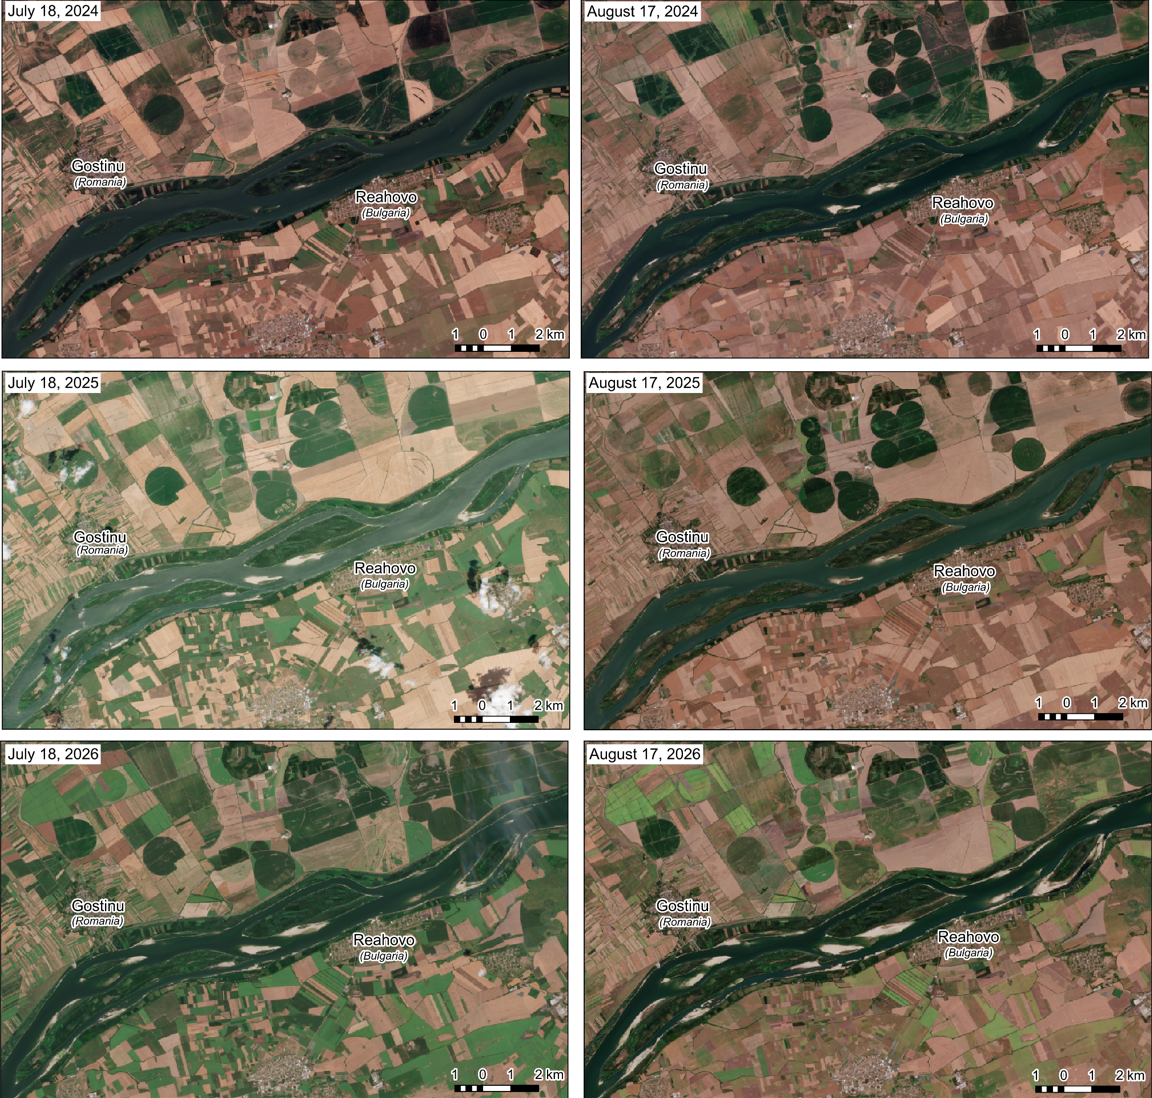
A person standing on the riverbank sees a cross-section of the river. A satellite can captured the river as a continuous feature. The European Union’s Copernicus Programme [6] provides free satellite imagery. By comparing images of the same area but taken at different times, we can see the changes occurring over time in various features on the Earth’s surface. For the Danube River, we can see where sandbanks appeared and observe changes in the shape of the riverbed. To illustrate this, we compared six Sentinel-2 satellite images of the same section of the Danube, downstream from Giurgiu (Romania) and Ruse (Bulgaria), near the localities of Gostinu (on the Romanian bank) and Prahovo (on the Bulgarian bank). These images cover the months of July and August across three consecutive years: 2024, 2025 and 2026.
Satellite images cannot explain directly the cause of the decrease of the Danube water levels. However, they show the spatial extent of the effects across the river. Consequently, these images complement the data recorded at hydrological and meteorological stations.
An exceptional episode or a new pattern?
With August drawing to a close, the hydrological situation on the Danube remains critical. From a climatological point of view, this is one of the months in which the Danube flows usually reach their annual minimum values due to high temperatures and high evapotranspiration. However, with the autumn rains and the restoration of water stocks in the supply basins, the flow and level of the Danube will gradually return to values close to normal. As the water rises, the sandbanks will be covered with water, and shipwrecks or other historical vestiges will also disappear until a new episode of hydrological drought. However, this seasonal phenomenon does not diminish the underlying concern: the Danube’s increasing vulnerability to severe water-deficit periods within a transboundary river basin, altered by human activity, where droughts of growing frequency and intensity are being observed.
The 2026 drought may be an exceptional episode, or it may be a glimpse of a more variable future. Only time will show us. Perhaps the question we should be asking ourselves is not when the sandbanks or wrecks will appear again, but how often we will see them in the years to come and how Europe is prepared to manage these drought episodes at the basin-wide level.
[1] https://www.waterdiplomat.org/story/2026/08/low-river-flows-europe
[4] https://link.springer.com/chapter/10.1007/978-1-4939-2380-9_11
[5] https://drought.emergency.copernicus.eu/tumbo/edo/map/
[6] https://www.copernicus.eu/en
Read also
“Evolution: There is a Tendency Toward Homo – A Paradigm Shift” Vincent Fleury (Exclusive Interview)
Understanding the Cyber Security Fallout of Geopolitical Tensions
Leave a Reply