As every June, the Statistical Review of World Energy — that collection of statistics indispensables to energy geopolitics — has duly been published. From 1954 to 2022 it was BP that compiled these data; initially devoted to oil, they were gradually broadened to all fossil fuels, then to renewables and nuclear. Since 2023 the Energy Institute has carried on this essential work, adding many further data related to the energy transition. The 75th edition, containing the 2025 data, appeared on 30 June 2026.
The conclusion, once again, will surprise only those who refuse to look at the figures: the world continues to depend massively on fossil fuels. Globally, the expansion of renewable sources still lags behind an energy demand that keeps rising, and fossil fuels still account for the largest share of that growth. The world is not undergoing an energy transition but an energy addition: the new renewables supplement conventional sources rather than replace them. In 2025 world consumption even passed the 600-exajoule (EJ) mark for the first time. Let us turn to the details.
Fossil fuels: the unshakeable bedrock of world energy
In 2025, world energy demand (total energy supply) rose by 1.7% compared with 2024, driven by an increase in every form of energy, to reach 600.3 EJ. Over the decade 2015–2025 — that is, the first ten years of the Paris Agreement — this consumption climbed by 14.6%, with sharply contrasting regional dynamics: the European Union declined by about 1% a year while the Asia-Pacific region grew by 2.6% a year. Growth comes, as always, from the non-OECD countries, which account for the largest share and the strongest annual increases.
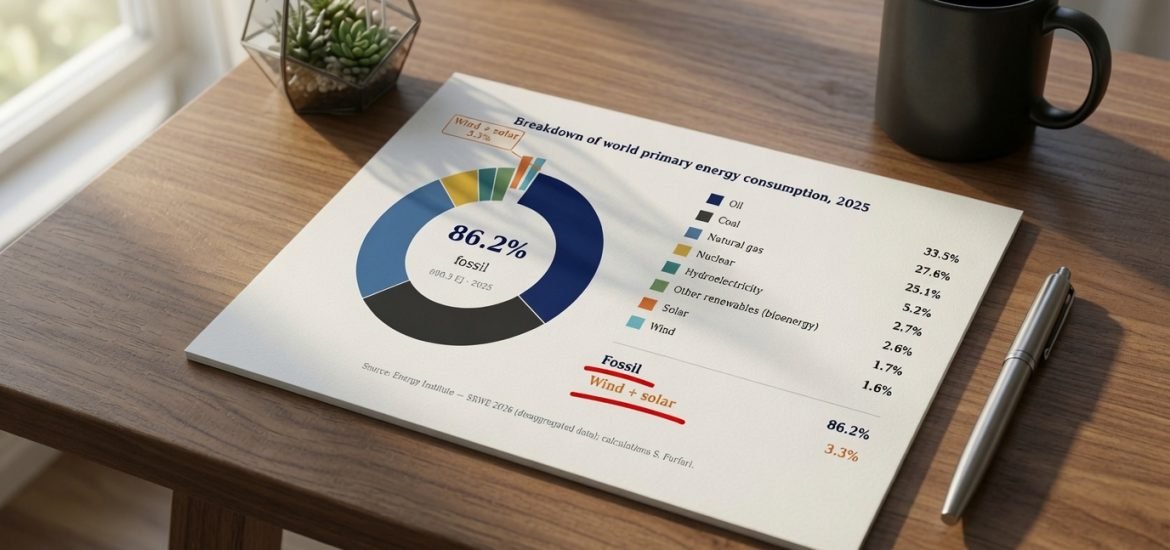
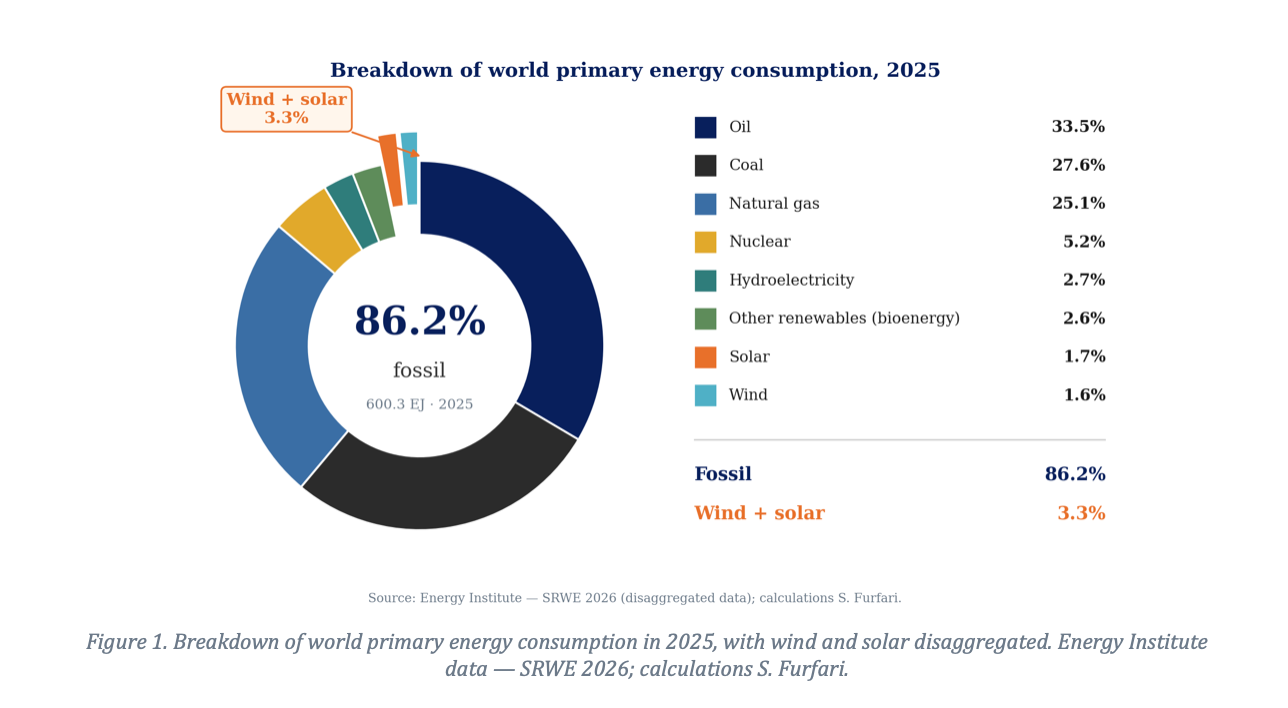
It must be said plainly, in the hope of being heard if not heeded: fossil fuels remain the cornerstone of the world energy system, with nearly 86% of total primary energy consumption in 2025 — oil at 33.5%, coal at 27.6% and natural gas at 25.1%. This proportion is far above the 80% figure still commonly cited. Nuclear supplied 5.2% and hydroelectricity 2.7%. As for the renewables so heavily promoted by the European Commission, wind accounted for only 1.6% and solar for 1.7%: together, barely 3.3% of the world primary balance — a share that remains marginal — while the energies that this same Commission would like to see abandoned account for 86.2%.
The Energy Institute confirms it only reluctantly: every form of energy reached record highs, and while renewables are the leading source of growth, fossil fuels still covered 60% of the rise in world demand in 2025. In the United States, the fossil share of growth even reaches 88%. We are very far from a switch from a carbon-based system to a low-carbon one: we are, at best, in an energy diversification.
Let us note in passing a discreet admission in the report: energy-efficiency gains (relative to GDP growth) stayed at 2% in 2025, well below the 4% annual improvement target set with great fanfare at COP28. Yet another target joining the graveyard of climate promises.
The EU’s green ambitions: leadership or illusion?
To assess the so-called transition policies, it is useful to compare the trajectory of the European Union with that of the rest of the world. The question is simple: is the EU truly at the forefront of a global movement, or is its isolation deepening?
The answer lies in the orders of magnitude. Over the decade following the adoption of the Paris Agreement, the European Union reduced its energy demand by about 1% a year, while the world increased its own by 14.6%, or nearly 77 EJ more. This European contraction is no ecological feat: it is the symptom of a competitiveness undermined by the Green Deal, a tragedy that the Draghi report itself acknowledges — without daring to attribute the cause to the Green Deal, preferring to blame energy prices that are themselves the direct consequence of European energy policy.
The striking fact has not changed since last year: the growth of fossil fuels outside the EU continues to outstrip, by a wide margin, that of modern renewables. Contrary to the belief widespread in Brussels that the gap between renewables and fossil fuels is narrowing, the reality is that this gap, in absolute terms, keeps widening. The EU has indeed transformed its electricity sector and set benchmarks in the integration of renewables; but this leadership remains purely symbolic, because the rest of the world is accelerating its use of fossil fuels far faster than that of renewables. When a leader turns round and sees that no one is following, he ought to ask whether he is really leading.
It will be noted that, compared with previous editions of the Statistical Review of World Energy, the language is markedly more favourable to renewables, to the point that one may be surprised by this shift. One explanation may lie in the fact that this edition is produced in collaboration with Ember, which — according to its website — ‘is an energy think tank that aims to accelerate the clean energy transition with data and policy’.
Oil, gas and coal: the reality of world demand
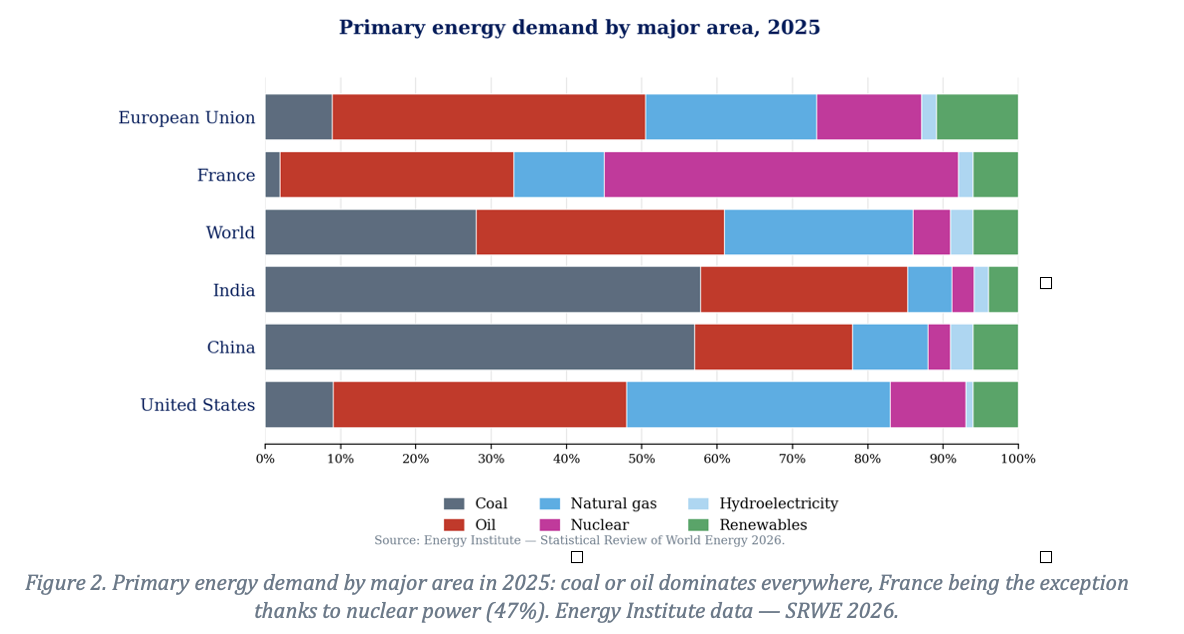
The global landscape is dominated by fossil fuels, but mainly coal and oil; both form the basis of energy consumption: in India, coal and oil accounts for over 80 per cent, in Chine for more than three-quarter, and globally, over 60 per cent. France is an exception. Thanks to its nuclear fleet, nuclear power accounts for 47 per cent of its primary energy and provides 68 per cent of its electricity generation. Its carbon footprint per kilowatt-hour is among the lowest in the industrialised world. This achievement is not the result of a decision to decarbonise, it is the outcome of a sovereign technological choice made fifty years ago, following the first oil crisis, by engineers and decision-makers who understood that energy is the primary prerequisite for national power.
World oil consumption stayed close to its record level. Notably, the Energy Institute stresses that global oil markets were rebalancing just before the Middle East conflict — we shall return to this, for that episode magnificently illustrates the inelasticity of oil demand. It is also worth noting that petrol and diesel consumption fell for the second consecutive year in China, while world demand for kerosene, the fuel of aviation, grew by 3.6%, driven by Asia-Pacific and the European Union.
As for coal, whose decline the media have been announcing for years, it remains by far the world’s leading source of electricity. China’s coal consumption alone now exceeds 92 exajoules per year, which is nearly 1.8 times the total primary energy consumption – from all sources combined – of all twenty-seven Member States of the European Union. Coal in power generation dipped only slightly at the global level (−0.3%), and above all it rose by 13% in the United States, where it displaced gas — because shale gas can be exported more easily than coal. Asia-Pacific remains the heart of world coal consumption. This is what must be borne in mind when the EU claims to be showing the way: the contrast between European green rhetoric and the reality of world demand has never been so striking.
The inelasticity of oil demand: the lesson of the Strait of Hormuz
One lesson deserves particular development this year, which I had not addressed before: the inelasticity of oil demand. The Strait of Hormuz crisis was a forceful reminder of it. Oil is not a commodity like any other: it feeds transport, agriculture, petrochemicals and a multitude of uses for which there is, for a long time to come, no substitute. Its demand therefore reacts only weakly to price changes.
The graph constructed from Energy Institute data (the WTI price against world consumption) illustrates this point strikingly. If the barrel price obediently followed the law of supply and demand, one would observe a clear and stable relationship between quantity consumed and price. Yet that is not what the facts show: the scatter of points coils on itself, forms loops, and the exponential fit explains only a small part of the variance (R² = 0.54). In other words, the correlation between price and consumption is poor: demand carries on almost independently of price, because it is incompressible.
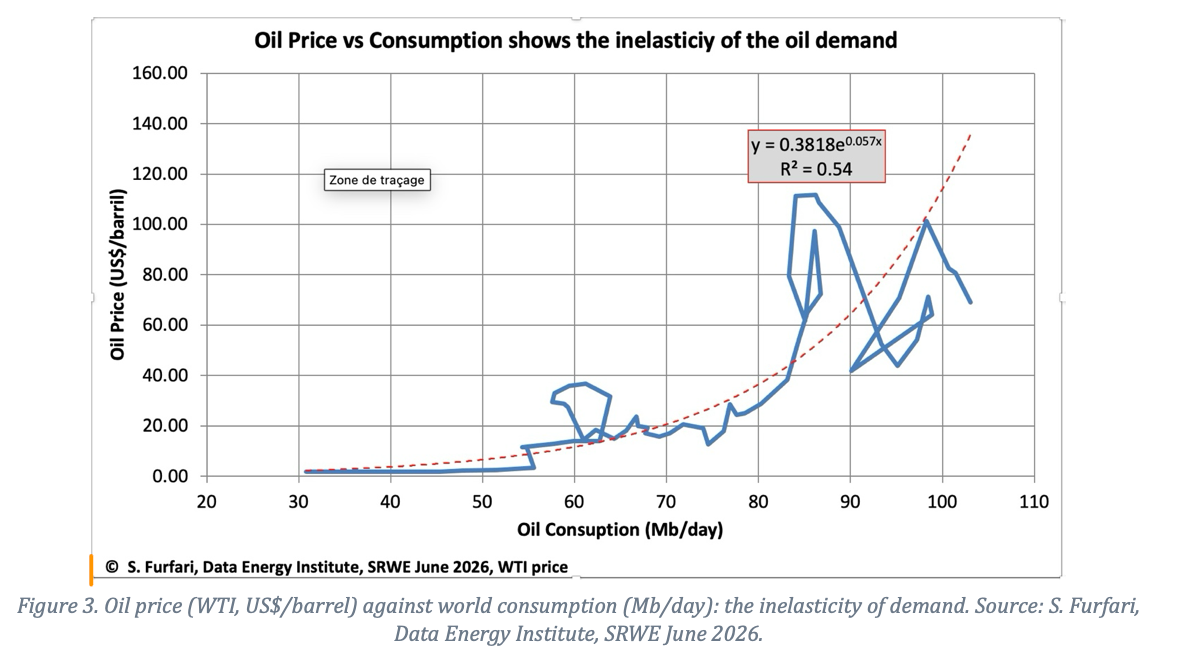
It is precisely this inelasticity that makes oil so strategic and explains the nervousness of markets whenever a threat looms over the Strait of Hormuz, through which a considerable share of the world’s crude passes. An economy cannot, overnight, ‘consume less’ because the price rises: it pays. This is also why the member states of the IEA and of the EU are required, under the treaty of the International Energy Agency and the European stockholding directive, to hold strategic oil reserves equivalent to about 90 days of net imports. One does not build up such reserves for an energy whose imminent disappearance one is preparing; one builds them up because one knows it will remain vital for a long time to come.
The emissions divide: world realities and climate aspirations
These trends have a direct effect on carbon-dioxide emissions. In 2025, world emissions related to energy reached 41 billion tonnes of CO₂ equivalent, up 1.1%. An irony that supporters of the Green Deal will prefer not to note: nearly 40% of this increase comes from the United States, whose emissions rose by 3.2% owing to a 13% rise in coal-fired electricity generation. American emissions thus grew four times faster than China’s.
China, still by far the world’s leading emitter (30.5% of the total in 2025), saw its emissions rise by only 0.3%, and India’s by 0.9% — two figures below the world average. Those of the European Union rose by 0.4%.
A single comparison sums up Europe’s isolation. Between 2015 and 2025 ― since the Paris Agreement ― the European Union cut its CO₂ emissions by about 554 million tonnes, while the rest of the world increased its own by 3,008 million tonnes — nearly six times as much, and in the opposite direction. The European effort, however costly, is swallowed up almost instantly by the rest of the planet.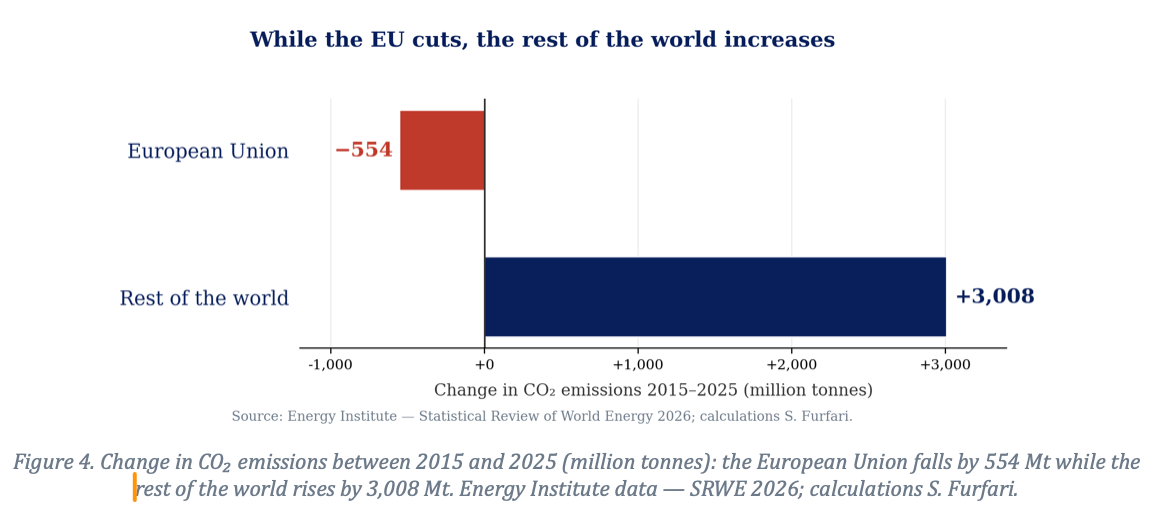
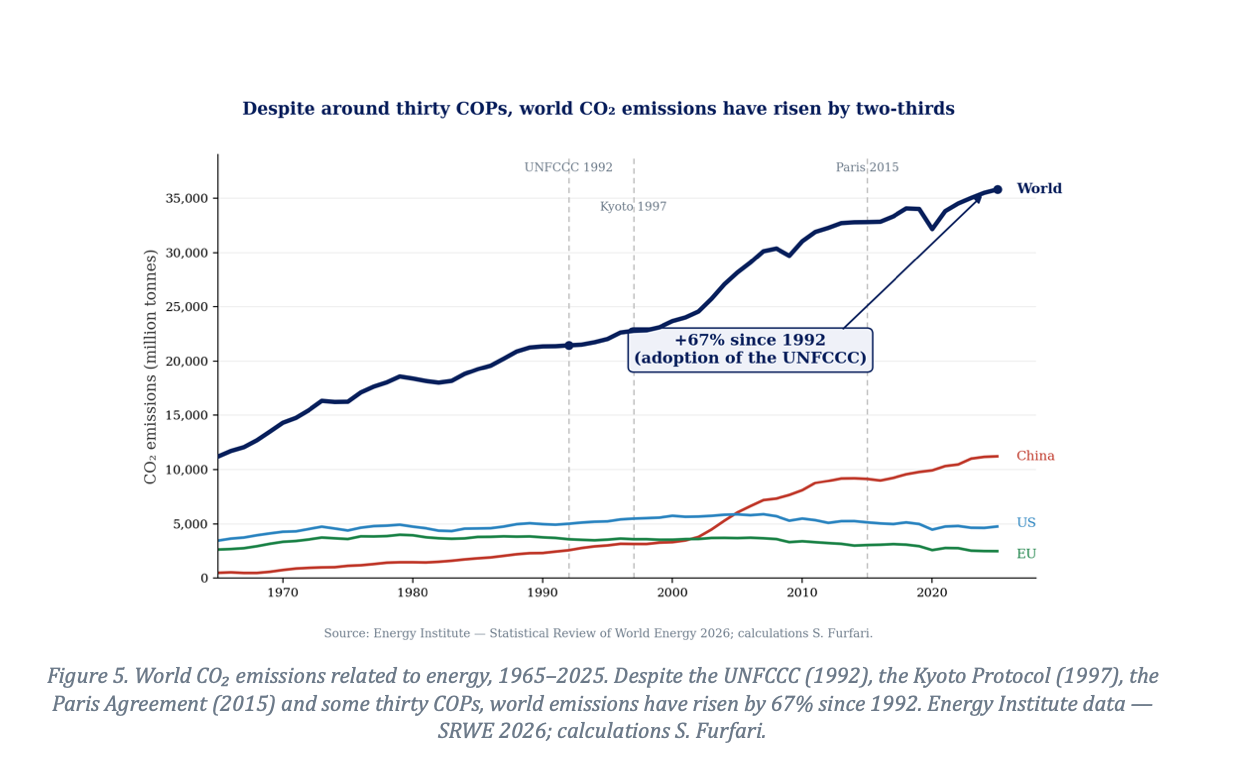
The most damning point for thirty years of climate diplomacy is the following: since the adoption of the United Nations Framework Convention on Climate Change (UNFCCC) in 1992, world CO₂ emissions related to energy have risen by 67% according to the latest Statistical Review of World Energy. Thirty years of conferences of the parties, from Kyoto to Paris, some thirty successive COPs — and the result is a two-thirds increase. While the EU has indeed cut its emissions by about 30% since 1990, that effort, achieved at the cost of billions of euros and a creeping deindustrialisation, has been entirely swallowed by Chinese growth alone, let alone the rest of the world.
China: the wager on growth so as not to end like the USSR
Figure 5 highlights a clear break in China’s trajectory at the turn of the 2000s: hitherto moderate, the curve soars. One would be tempted to see the imprint of a leader; but Xi Jinping did not come to power until 2012. The real trigger is earlier: China’s accession to the World Trade Organization in December 2001, which turned the country into the workshop of the world. Under Hu Jintao, forced-march industrialisation, mass urbanisation and the frenzied building of infrastructure caused coal demand to explode — coal of which China has become, by a very wide margin, the world’s leading consumer.
Behind this acceleration lies a fundamental political decision. The Chinese Communist Party drew the lesson of the collapse of the Soviet Union: the USSR did not perish under arms, but for want of growth, and hence of any improvement in its population’s standard of living. So as not to suffer the same fate, Beijing made the opposite wager — that of rapid economic growth, the only lasting source of legitimacy for a single-party regime. Yet that growth still rests, to this day, on abundant and cheap energy: first and foremost on coal.
This is why China’s emissions can only continue to rise. Hundreds of millions of Chinese have not yet reached the standard of living of the privileged of Shanghai or Beijing — a gap that a power claiming to stand for equality cannot tolerate indefinitely. Their access to prosperity will require more energy, and that energy will be, for the most part, fossil. No climate conference will change any of this: for China, growth is not an option but a condition of the regime’s survival.
Outside the halls of Brussels and Strasbourg, the interest of national leaders lies in the prosperity of their peoples, not in the utopian goal of global decarbonisation. Even if the EU pursued its decarbonisation to the point of extinction — together with its economic degrowth — it would change nothing in the dynamics of world emissions. It is therefore no exaggeration to say that the European Union is spending fortunes for a negligible reduction, at once offset elsewhere.
Electricity: a ‘historic milestone’ that masks the essential
World electricity demand continues to grow faster than overall energy demand, up 3% in 2025, driven by new engines: electric vehicles, data centres and artificial intelligence. Generation from renewables (excluding hydro) even slightly exceeded the rise in electricity demand, with solar growing by nearly 30% worldwide. Solar passed 8.7% of the world electricity mix, overtaking wind (8.4%) for the first time and closing in on nuclear (8.8%).
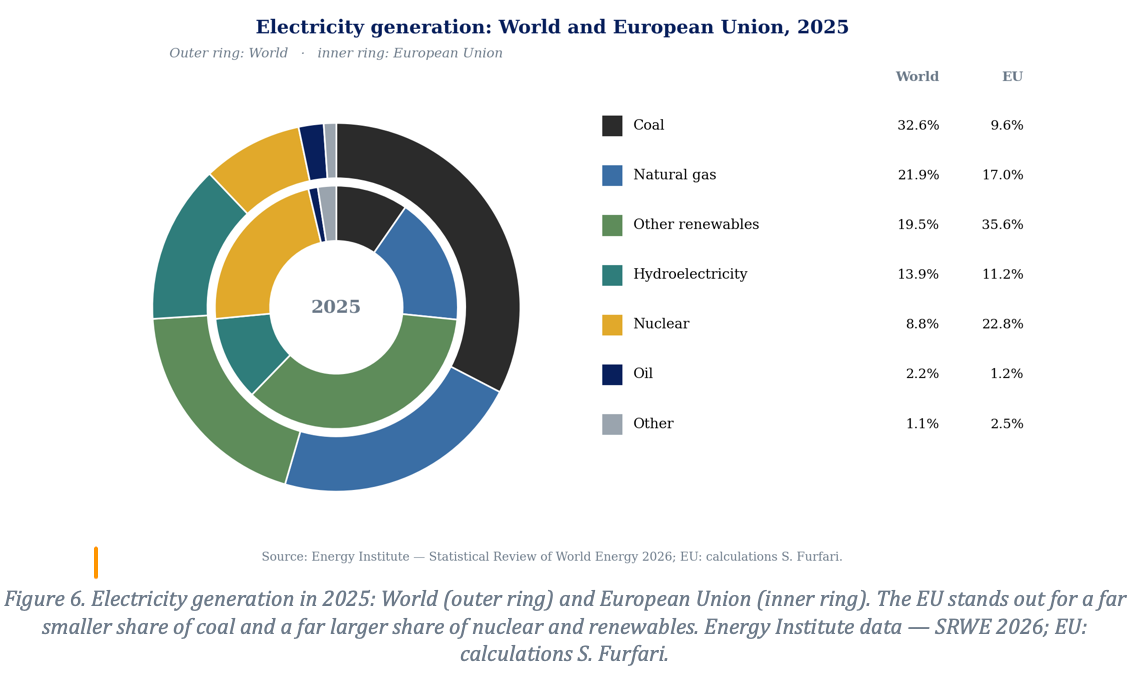
The Energy Institute celebrates a ‘historic milestone’: all renewable sources combined (including hydroelectricity, 33.4%) would for the first time have produced slightly more electricity than coal (32.6%). But make no mistake: coal remains, on its own, the world’s leading source of electricity, and electricity is only a fraction of final energy. Confusing the electricity mix with the total energy balance is the most widespread error — or trick — of the prevailing discourse.
It is also worth recalling a physical truth that solar triumphalism tends to obscure: wind and solar are both variable and intermittent — two distinct notions. Variable, because their output fluctuates constantly with the wind and the sunshine; intermittent, because they stop altogether, at night or in calm weather. No quantity of batteries, whose installed capacity nonetheless jumped by 66% in 2025, so far turns these sources into dispatchable suppliers at the scale of a system. This is why coal, gas and nuclear remain the true backbone of the world’s electricity supply.
To give a sense of the scale of the battery requirement, note that it would take 117 Tesla Model S (100 kWh battery) or 690,000 iPhones to store all the electricity produced by a 700 MW power station for a single minute.
China, once again, posted a record year for wind and solar — on its own exceeding the rest of the world combined — while slightly reducing its coal-fired generation. But its coal fleet remains colossal, and there is no sign that it is giving up the security afforded by this abundant domestic resource.
Addition, but not transition
We have not exhausted all the data in this 75th edition. The aim was to bring out the yawning geopolitical gap between the results of the EU’s energy policy and those of the rest of the world. Despite the omnipresent rhetoric of the energy transition — the Energiewende raised to a dogma — the evidence must be faced: fossil fuels remain the backbone of the world energy system, with nearly 86% of total consumption, far above the 80% figure still too often put forward. This dominance persists even as wind and solar, variable and intermittent, expand. The world is undergoing an energy addition, not a transition: sources are added to existing sources, they are not substituted for them.
The great majority of mankind aspires to more prosperity and quality of life — that is, to abundant and cheap energy, the very energy that the European Union sought before its conversion to environmentalism. Economic and social imperatives, together with the requirement of security of supply, make any retreat of fossil fuels at the world scale highly improbable. The gap between climate ambitions and the reality of consumption will therefore only widen.
The failure to meet the announced climate targets is now so manifest — two-thirds more world emissions since the UNFCCC — that it becomes reasonable to anticipate, in time, the abandonment of the Paris Agreement, so difficult will it be to conceal its bankruptcy. Paradoxically, at the very moment when the Statistical Review of World Energy demonstrates this failure, the European Commission persists in proposing utopian targets, such as a 90% cut in its emissions by 2040. When a leader turns round and sees no one behind him, he would do well to ask whether he is still leading — or whether he has strayed off alone.
Notes
(1) Other renewables, essentially bioenergy, account for 2.6%. It is regrettable that, in its total balance (total energy supply), the Energy Institute does not disaggregate the renewables figures: this aggregation masks the marginality of the very sources — solar and wind — that are so widely championed.
(2) Mario Draghi, The future of European competitiveness — Part A: A competitiveness strategy for Europe; Part B: In-depth analysis and recommendations, European Commission, 9 September 2024. The report explicitly identifies energy prices as a decisive factor in EU competitiveness (https://commission.europa.eu/topics/competitiveness/draghi-report_en). See also my analysis: S. Furfari, ‘The Draghi report: a mistaken vision of the EU’s energy future’ https://clintel.org/wp-content/uploads/2025/08/Draghi-report-v4.pdf
(3) https://ember-energy.org.
Further reading
“I Eat, Therefore I Live: A Lot of Science and a Pinch of Common Sense” Philippe Legrand (interview)
« Germany’s Nuclear Mea Culpa: Too Little, Too Late – The Harm Is Done » – C. Semperes (interview)
https://www.europeanscientist.com/en/agriculture/agricultural-decline-france-is-the-deadweight-of-the-eu-laurent-duplomb-interview/
Leave a Reply